Spatially Varying Costs of GHG Abatement with Alternative Cellulosic Feedstocks for Sustainable Aviation Fuels
Themes: Sustainability
Keywords: Geospatial, Modeling
Citation
Fan, X., Khanna, M., Lee, Y., Kent, J., Shi, R., Guest, J.S., Lee, D.K. June 20, 2024. “Data for Spatially Varying Costs of GHG Abatement with Alternative Cellulosic Feedstocks for Sustainable Aviation Fuels.” University of Illinois Urbana-Champaign. DOI: 10.13012/B2IDB-5045812_V1.
Overview

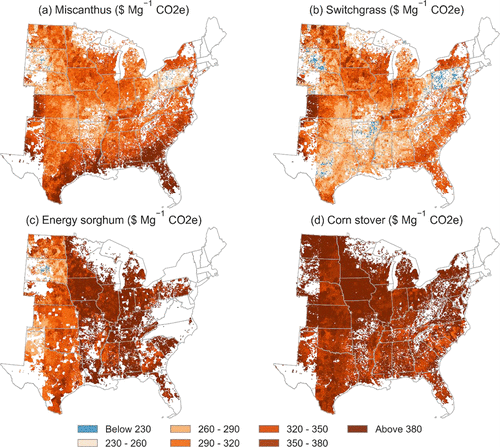
Cellulosic biomass-based sustainable aviation fuels (SAFs) can be produced from various feedstocks. The breakeven price and carbon intensity of these feedstock-to-SAF pathways are likely to differ across feedstocks and across spatial locations due to differences in feedstock attributes, productivity, opportunity costs of land for feedstock production, soil carbon effects, and feedstock composition. We integrate feedstock to fuel supply chain economics and life-cycle carbon accounting using the same system boundary to quantify and compare the spatially varying greenhouse gas (GHG) intensities and costs of GHG abatement with SAFs derived from four feedstocks (switchgrass, miscanthus, energy sorghum, and corn stover) at 4 km resolution across the U.S. rainfed region. We show that the optimal feedstock for each location differs depending on whether the incentive is to lower breakeven price, carbon intensity, or cost of carbon abatement with biomass or to have high biomass production per unit land. The cost of abating GHG emissions with SAF ranges from $181 Mg−1 CO2e to more than $444 Mg−1 CO2e and is lowest with miscanthus in the Midwest, switchgrass in the south, and energy sorghum in a relatively small region in the Great Plains. While corn stover-based SAF has the lowest breakeven price per gallon, it has the highest cost of abatement due to its relatively high GHG intensity. Our findings imply that different types of policies, such as volumetric targets, tax credits, and low carbon fuel standards, will differ in the mix of feedstocks they incentivize and locations where they are produced in the U.S. rainfed region.
Data
- Breakeven prices and GHG abatement costs of various crops
- GHG intensities
- DayCent management scenarios and simulated yields