Data for Genetics of Flooding Tolerance in an F2 Miscanthus sacchariflorus ssp. lutarioriparius × M. sinensis Population
Themes: Feedstock Production
Keywords: Genetics, Miscanthus
Citation
Zerpa-Catanho, D., Xioa, L., LaBonte, N., Yoshinaga, Y., Blow, M., Barry, K., Kuang, X., Cebert, E., Mitros, T., Rokhsar, D., Swaminathan, K., Sacks, E. July 5, 2026. Data for: “Genetics of Flooding Tolerance in an F2 Miscanthus sacchariflorus ssp. lutarioriparius × M. sinensis Population.” University of Illinois Urbana-Champaign. DOI: 10.13012/B2IDB-4118043_V1.
Overview
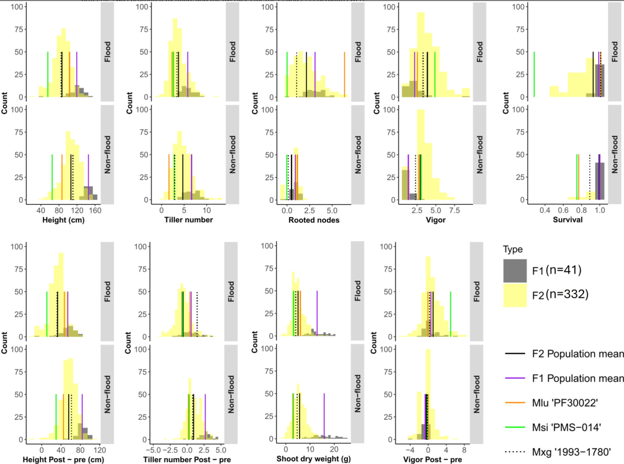
This dataset contains all data and supplementary materials from “Genetics of flooding tolerance in an F2 Miscanthus sacchariflorus ssp. lutarioriparius × M. sinensis population“.
- The dataset S1 table contains the raw phenotypic data collected during the experiment.
- The dataset S2 table contains the LSmean values for the 24 traits studied.
- The dataset S3 table contains the TASSEL GBSv2 map, marker information, and genotype data used for mapping.
- The dataset S4 table contains information on candidate genes found in each of the QTL intervals.
- The dataset S5 table contains the GO annotations and KEGG enrichment analyses for those candidate genes.
- The dataset S6 table contains information on the sequences used to classify AP2 ERF transcription factors.
- The dataset S7 table contains information on AP2 ERF orthologs between Miscanthus and rice based on synteny.
- Supplementary file 1 contains the ANOVA results using the raw phenotypic data collected from protocol “A”.
- Supplementary file 2 contains the ANOVA results using the raw phenotypic data collected from protocol “B”.
- Supplementary file 3 contains notes on the comparison of SNP calling methods.
- Supplementary file 4 is a script for analyzing candidate genes found in QTL intervals.
Data
Illinois Data Bank: Phenotypic data, LSmean values, map/marker information/genotype data, candidate genes, ANOVA results, additional data and supplementary materials
NCBI: MxG LxMxiPilot Sequencing
NCBI: MxG Lutario x Msi F1 Lib2 Sequencing
NCBI: MxG Lutario x Msi F1 Lib3 Sequencing